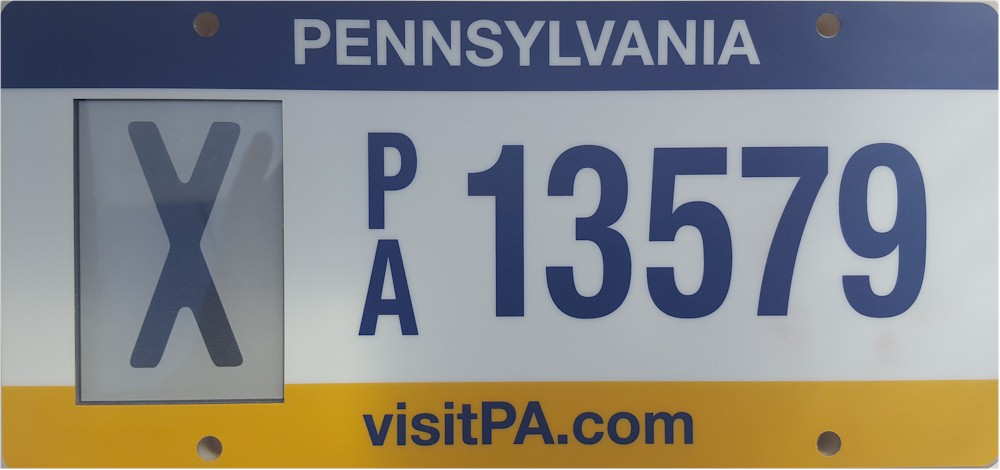
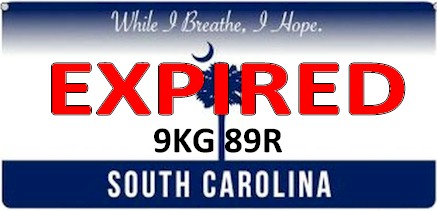
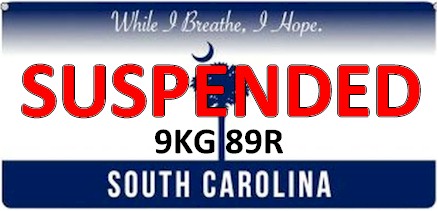
Compliance Innovations, LLC is a Columbia, SC based company developing an Electronic Vehicle License Plate. Our license plate will have the capability to retain the image without power for up to 10 years. It also allows the issuing agency or law enforcement the capability to change the status of the license plate, regardless of the vehicle location, when the compliance status changes to expired or suspended.
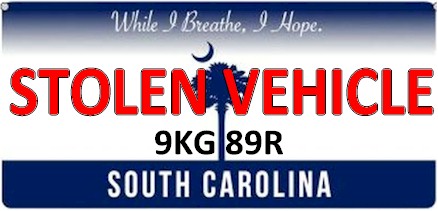
The ability to immediately and visibly revoke a license plate will require owners to comply with insurance and registration laws resulting in decreased financial losses for insurance companies, lower premiums for owners and an increased and equitable revenue collection for government jurisdictions. The interface with law enforcement will help provide a means to more quickly identify vehicles that are stolen, associated with serious violations or used in the commission of a crime.
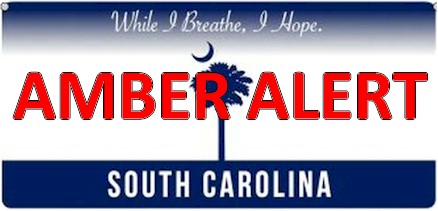
Columbia, S.C. – Columbia-based Compliance Innovations, LLC is now conducting internal testing of its Generation IV digital license plate. The company, founded by David Findlay and Brian Bannister ten years ago, specializes in producing electronic vehicle license plates that can be used by law enforcement to determine if the vehicle is stolen, handicapped, uninsured or even involved in an Amber Alert.
The product will reduce the volume of uninsured drivers on our roads and increase compliance and compliance-related revenues for state and local governments. According to the national Insurance Council, 15% of drivers are uninsured costing the nation approximately $150 billion a year.
The battery-powered plate is less than half of an inch thick and receives cell signals from a central server to update the tag display. The Gen IV product is fully ruggedized, water-proof and will be available for further testing by states and foreign governments. The tag will last five years if updated daily or more than eight years if updated monthly. Initially, the plate will be tested in states that have expressed interest.
Demonstration and negotiations for testing are underway in Washington D.C., California, Florida and Pennsylvania. California and Florida have passed legislation authorizing the development and study of digital license places.
Following the successful completion of the internal test cycle, Compliance Innovations will begin pilot testing the tag across the nation, and soon the globe.
For more information on the Generation IV digital license plate or compliance Innovations, LLC, please visit www.complianceinnovations.com or contact Richard Butcher at dick@complianceinnovations.com
About Compliance Innovations
Founded in 2006, Compliance Innovations, LLC is a Columbia, South Carolina based company developing an Electronic Vehicle License Plate. The plate is designed to allow the issuing agency or law enforcement the capability to change the status of the license plate, regardless of the vehicle location, when the compliance status changes to expired or suspended.
Contact:
Richard Butcher
(803) 609-7309
dick@complianceinnovations.com
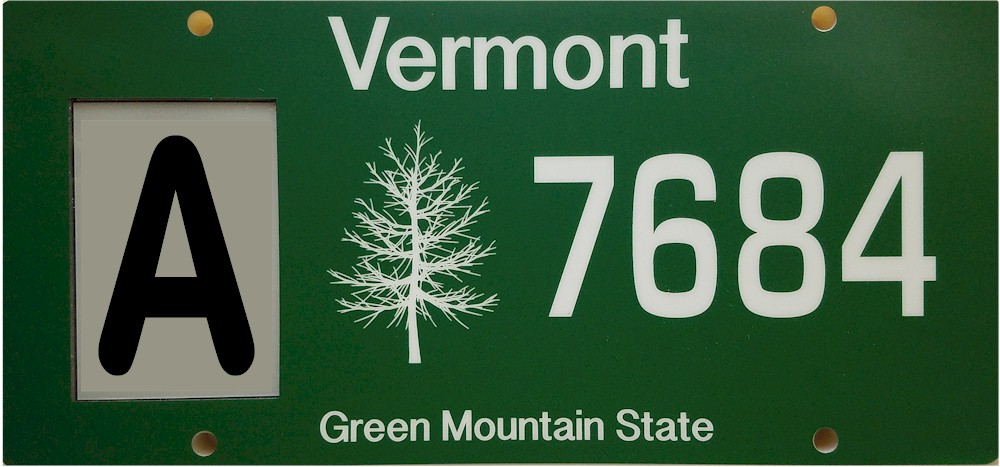
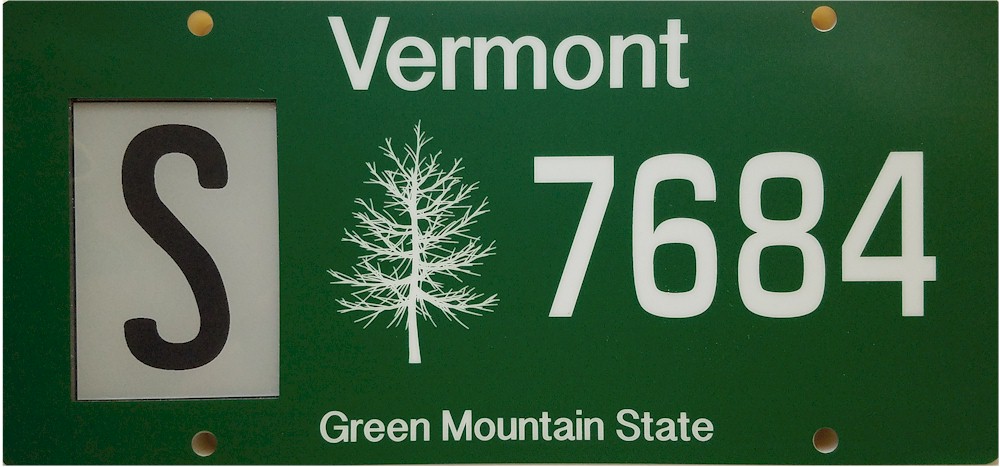
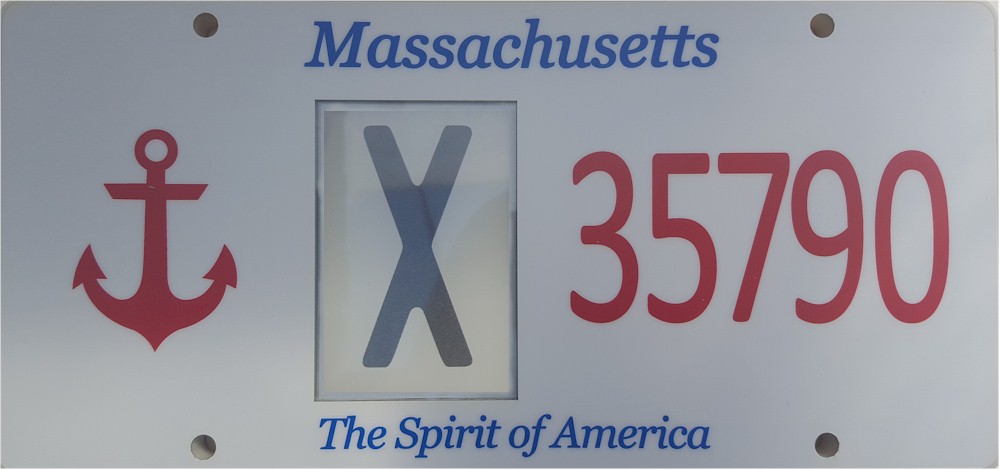
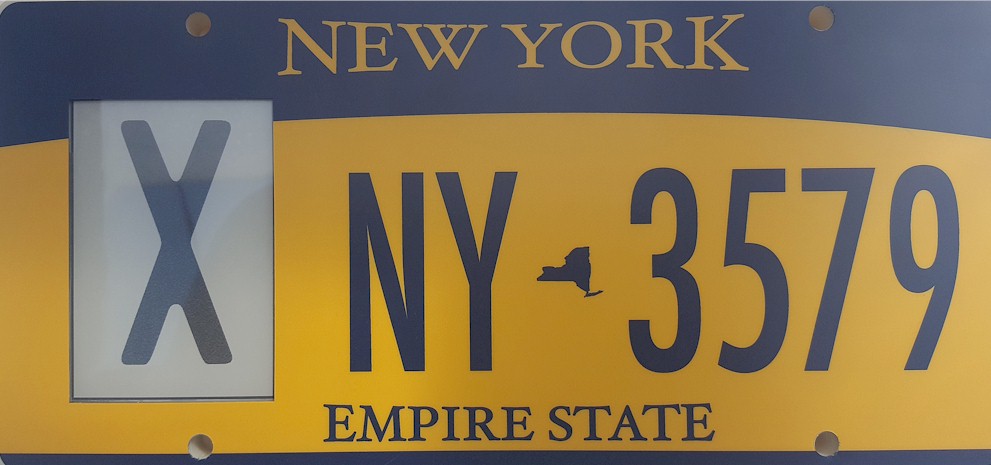
Click your state |
| State | Vehicles Count (as of 2011) | Per Cent Uninsured (as of 2009) | Uninsured Vehicles | Annual Fee Revenues Lost (1) | Annual Insurance Premiums Lost(2) | Social Cost of Accidents Involving Uninsured Motorists (3) |
|---|---|---|---|---|---|---|
| Alabama | 4,811,943 | 25% | 1,202,986 | $66,404,813 | $902,239,313 | $2,850,500,598 |
| Alaska | 757,954 | 15% | 113,693 | $9,095,448 | $85,269,825 | $448,997,075 |
| Arizona | 5,109,254 | 22% | 1,124,036 | $84,174,960 | $843,026,910 | $3,026,621,799 |
| Arkansas | 2,448,310 | 14% | 342,763 | $31,828,030 | $257,072,550 | $1,450,330,795 |
| California | 29,176,697 | 25% | 7,294,174 | $405,556,088 | $5,470,630,688 | $17,283,702,702 |
| Colorado | 4,332,251 | 15% | 649,838 | $25,928,522 | $487,378,238 | $2,566,340,471 |
| Connecticut | 2,828,794 | 12% | 339,455 | $21,215,955 | $254,591,460 | $1,675,722,050 |
| Delaware | 929,415 | 12% | 111,530 | $6,505,905 | $83,647,350 | $550,567,206 |
| Dist. of Col. | 316,231 | 21% | 66,409 | $2,134,559 | $49,806,383 | $187,329,038 |
| Florida | 15,469,189 | 19% | 2,939,146 | $170,934,538 | $2,204,359,433 | $9,163,643,977 |
| Georgia | 7,533,735 | 10% | 753,374 | $134,100,483 | $565,030,125 | $4,462,836,762 |
| Hawaii | 1,148,041 | 13% | 149,245 | $10,183,124 | $111,933,998 | $680,076,958 |
| Idaho | 1,625,204 | 9% | 146,268 | $8,126,020 | $109,701,270 | $962,738,955 |
| Illinois | 10,445,208 | 16% | 1,671,233 | $202,637,035 | $1,253,424,960 | $6,187,536,229 |
| Indiana | 6,132,772 | 16% | 981,244 | $22,108,643 | $735,932,640 | $3,632,933,776 |
| Iowa | 3,496,576 | 12% | 419,589 | $18,182,195 | $314,691,840 | $2,071,303,001 |
| Kansas | 2,445,966 | 13% | 317,976 | $14,675,796 | $238,481,685 | $1,448,942,256 |
| Kentucky | 3,763,027 | 12% | 451,563 | $11,665,384 | $338,672,430 | $2,229,143,344 |
| Louisiana | 4,052,596 | 10% | 405,260 | $32,218,138 | $303,944,700 | $2,400,678,337 |
| Maine | 1,171,280 | 4% | 46,851 | $9,428,804 | $35,138,400 | $693,843,285 |
| Maryland | 3,905,629 | 12% | 468,675 | $118,106,221 | $351,506,610 | $2,313,617,971 |
| Massachusetts | 5,695,327 | 6% | 341,720 | $74,039,251 | $256,289,715 | $3,373,799,943 |
| Michigan | 9,182,847 | 17% | 1,561,084 | $342,520,193 | $1,170,812,993 | $5,439,738,347 |
| Minnesota | 4,909,634 | 10% | 490,963 | $82,113,629 | $368,222,550 | $2,908,370,829 |
| Mississippi | 2,036,524 | 26% | 529,496 | $26,067,507 | $397,122,180 | $1,206,396,850 |
| Missouri | 5,169,994 | 12% | 620,399 | $52,604,689 | $465,299,460 | $3,062,602,983 |
| Montana | 1,219,158 | 12% | 146,299 | $13,654,570 | $109,724,220 | $722,205,273 |
| Nebraska | 1,886,956 | 8% | 150,956 | $4,717,390 | $113,217,360 | $1,117,795,702 |
| Nevada | 2,152,407 | 17% | 365,909 | $17,531,355 | $274,431,893 | $1,275,043,665 |
| New Hampshire | 1,278,484 | 9% | 115,064 | $10,381,290 | $86,297,670 | $757,348,831 |
| New Jersey | 7,939,956 | 9% | 714,596 | $89,324,505 | $535,947,030 | $4,703,474,111 |
| New Mexico | 1,772,040 | 24% | 425,290 | $18,252,012 | $318,967,200 | $1,049,721,719 |
| New York | 10,430,559 | 7% | 730,139 | $135,597,267 | $547,604,348 | $6,178,858,449 |
| North Carolina | 6,249,592 | 8% | 499,967 | $42,497,226 | $374,975,520 | $3,702,135,651 |
| North Dakota | 785,866 | 9% | 70,728 | $12,180,923 | $53,045,955 | $465,531,596 |
| Ohio | 10,217,277 | 15% | 1,532,592 | $58,749,343 | $1,149,443,663 | $6,052,514,378 |
| Oklahoma | 3,428,689 | 15% | 514,303 | $31,201,070 | $385,727,513 | $2,031,088,075 |
| Oregon | 3,128,120 | 12% | 375,374 | $37,537,440 | $281,530,800 | $1,853,036,898 |
| Pennsylvania | 10,302,980 | 10% | 1,030,298 | $60,272,433 | $772,723,500 | $6,103,283,153 |
| Rhode Island | 918,823 | 14% | 128,635 | $7,488,407 | $96,476,415 | $544,292,713 |
| South Carolina | 3,827,208 | 9% | 344,449 | $129,742,351 | $258,336,540 | $2,267,162,909 |
| South Dakota | 995,423 | 9% | 89,588 | $6,470,250 | $67,191,053 | $589,669,050 |
| Tennessee | 5,302,335 | 21% | 1,113,490 | $19,618,640 | $835,117,763 | $3,140,999,194 |
| Texas | 19,617,055 | 16% | 3,138,729 | $1,433,025,868 | $2,354,046,600 | $11,620,758,392 |
| Utah | 1,883,410 | 9% | 169,507 | $35,973,131 | $127,130,175 | $1,115,695,122 |
| Vermont | 605,054 | 6% | 36,303 | $4,174,873 | $27,227,430 | $358,422,115 |
| Virginia | 6,998,385 | 10% | 699,839 | $176,849,189 | $524,878,875 | $4,145,705,929 |
| Washington | 5,880,793 | 18% | 1,058,543 | $40,724,492 | $793,907,055 | $3,483,666,361 |
| West Virginia | 1,458,222 | 10% | 145,822 | $5,832,888 | $109,366,650 | $863,822,095 |
| Wisconsin | 5,244,195 | 14% | 734,187 | $75,778,618 | $550,640,475 | $3,106,558,199 |
| Wyoming | 798,296 | 11% | 87,813 | $2,315,058 | $65,859,420 | $472,894,884 |
| 253,215,681 | 15% | 37,957,390 | $4,452,446,518 | $28,468,042,823 | $150,000,000,000 |
| Notes |
| (1) Best estimates based on known fee structures by state, which changes and are hard to define in absolute terms. |
| (2) Estimated at $750 per year premium for all uninsured motorists forced to obtain adequate insurance coverage |
| (3) Per the Insurance Research Council |